1
我试图在网站上创建一个与图像类似的图。但是,我遇到了一个更基本的问题:R图中有一些我想摆脱的空白空间。这是使用包pROC。我已经提供了说明这一问题的可重复的例子:使用plot.roc()函数的R图中的白色边距
library("pROC")
plot.roc(c(1, 1, 0, 0, 1), c(3, 4, 5, 6, 7), legacy.axes=TRUE)
上面的代码最终看起来像下面的图片:

正如你所看到的,像有很多y轴和图的最左侧部分之间的空白区域,以及图的右侧。该问题仅在使用plot.roc()时发生。我甚至尝试制作我试图模拟的情节(使用网站上提供的代码),并且仍然以不同的图像结尾(下面包括第一段中描述的图像的代码):
library(pROC)
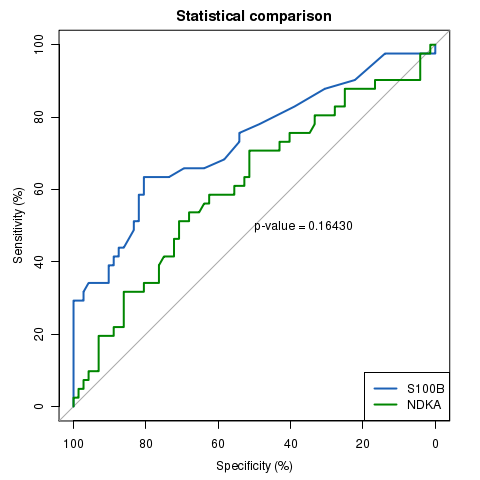
data(aSAH)
rocobj1 <- plot.roc(aSAH$outcome, aSAH$s100, main="Statistical comparison", percent=TRUE, col="#1c61b6")
rocobj2 <- lines.roc(aSAH$outcome, aSAH$ndka, percent=TRUE, col="#008600")
testobj <- roc.test(rocobj1, rocobj2)
text(50, 50, labels=paste("p-value =", format.pval(testobj$p.value)), adj=c(0, .5))
legend("bottomright", legend=c("S100B", "NDKA"), col=c("#1c61b6", "#008600"), lwd=2)

There is no white space in the original picture that used the exact same code。
虽然问题在第二台计算机上运行时仍然存在,但我的R设置可能有问题。有人能够协助吗?


下面是在第一段中描述的图像的链接:http://web.expasy.org/pROC/images/comparison.png – user6668342
原因是'ASP = 1'(plot.roc.roc *方法的默认值)。它通过'plot.roc(...,asp = F)'来解决。错误发生在你的代码中,最好使用'plot.roc(...,add = T)'而不是'lines.roc(...)'。 – cuttlefish44
工作,谢谢! – user6668342