0
我正在制作一个程序来绘制抛物线,并且我想让X和Y轴(来自(0,0)的轴)具有不同的颜色。我还没有找到任何选择,我找到的唯一解决方案是制作一个大网格,并将其增量设置为图形大小的一半。有其他选择吗?WinForms:突出显示X和Y轴
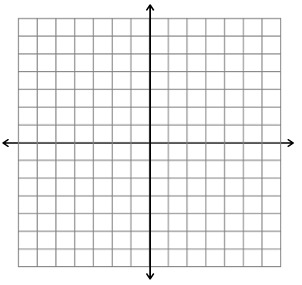
我使用了默认的图表控件。我希望是这样的:

我正在制作一个程序来绘制抛物线,并且我想让X和Y轴(来自(0,0)的轴)具有不同的颜色。我还没有找到任何选择,我找到的唯一解决方案是制作一个大网格,并将其增量设置为图形大小的一半。有其他选择吗?WinForms:突出显示X和Y轴
我使用了默认的图表控件。我希望是这样的:

您可以设置轴来Crossing轴移动到图表的中心。您也可以为轴设置LineWidth,使其更厚。你也可以设置ArrowStyle在轴的末尾有一个箭头。
例如,有这样一个图表:
使用这样的代码:
private void Form1_Load(object sender, EventArgs e)
{
    //Set Chart Margins
    this.chart1.ChartAreas[0].Position.Auto = false;
    this.chart1.ChartAreas[0].Position.X = 10;
    this.chart1.ChartAreas[0].Position.Y = 10;
    this.chart1.ChartAreas[0].Position.Width = 80;
    this.chart1.ChartAreas[0].Position.Height = 80;

    //Configure X Axis
    this.chart1.ChartAreas[0].AxisX.Crossing = 0;
    this.chart1.ChartAreas[0].AxisX.Interval = 1;
    this.chart1.ChartAreas[0].AxisX.LabelStyle.Enabled = false;
    this.chart1.ChartAreas[0].AxisX.LineWidth = 2;
    this.chart1.ChartAreas[0].AxisX.ArrowStyle =
     System.Windows.Forms.DataVisualization.Charting.AxisArrowStyle.Lines;

    //Configure Y Axis
    this.chart1.ChartAreas[0].AxisY.Crossing = 0;
    this.chart1.ChartAreas[0].AxisY.Interval = 5;
    this.chart1.ChartAreas[0].AxisY.LineWidth = 2;
    this.chart1.ChartAreas[0].AxisY.LabelStyle.Enabled = false;
    this.chart1.ChartAreas[0].AxisY.ArrowStyle =
     System.Windows.Forms.DataVisualization.Charting.AxisArrowStyle.Lines;

    //Set Chart Type
    this.chart1.Series[0].ChartType =
     System.Windows.Forms.DataVisualization.Charting.SeriesChartType.Spline;

    //Set Data
    var p = new List<PointF>();
    for (int i = -5; i <= 5; i++)
    {
     p.Add(new PointF(i, i * Math.Abs(i)));
    }
    this.chart1.DataSource = p;
    this.chart1.Series[0].XValueMember = "X";
    this.chart1.Series[0].YValueMembers = "Y";
    this.chart1.Series[0].IsVisibleInLegend = false;
}
如何创建的图表?使用GDI +和自定义绘画或使用MSChart或其他东西?请在问题中添加更多详细信息。同时添加一些代码或您期望的图像可能会有所帮助。 –
我使用了默认的图表控件。我希望像http://mathbits.com/MathBits/StudentResources/GraphPaper/14by14%20axes.jpg – TheRniz
[在Visual Studio中制作4面图/ 4面网格](http:// stackoverflow。 (在这篇文章中)(http://stackoverflow.com/questions/36119477)/也可以看看[在这篇文章中] /更好-axisarrowstyle-箭头换我-图表-轴/ 36119485#36119485) – TaW